
Compare the full cost of software implementation alternatives before you commit.
BBRmap goes beyond licensing and infrastructure costs to model your team's total spend in setup, engineering time, and operational burden.
Open the Kafka Demo
What costs are modeled
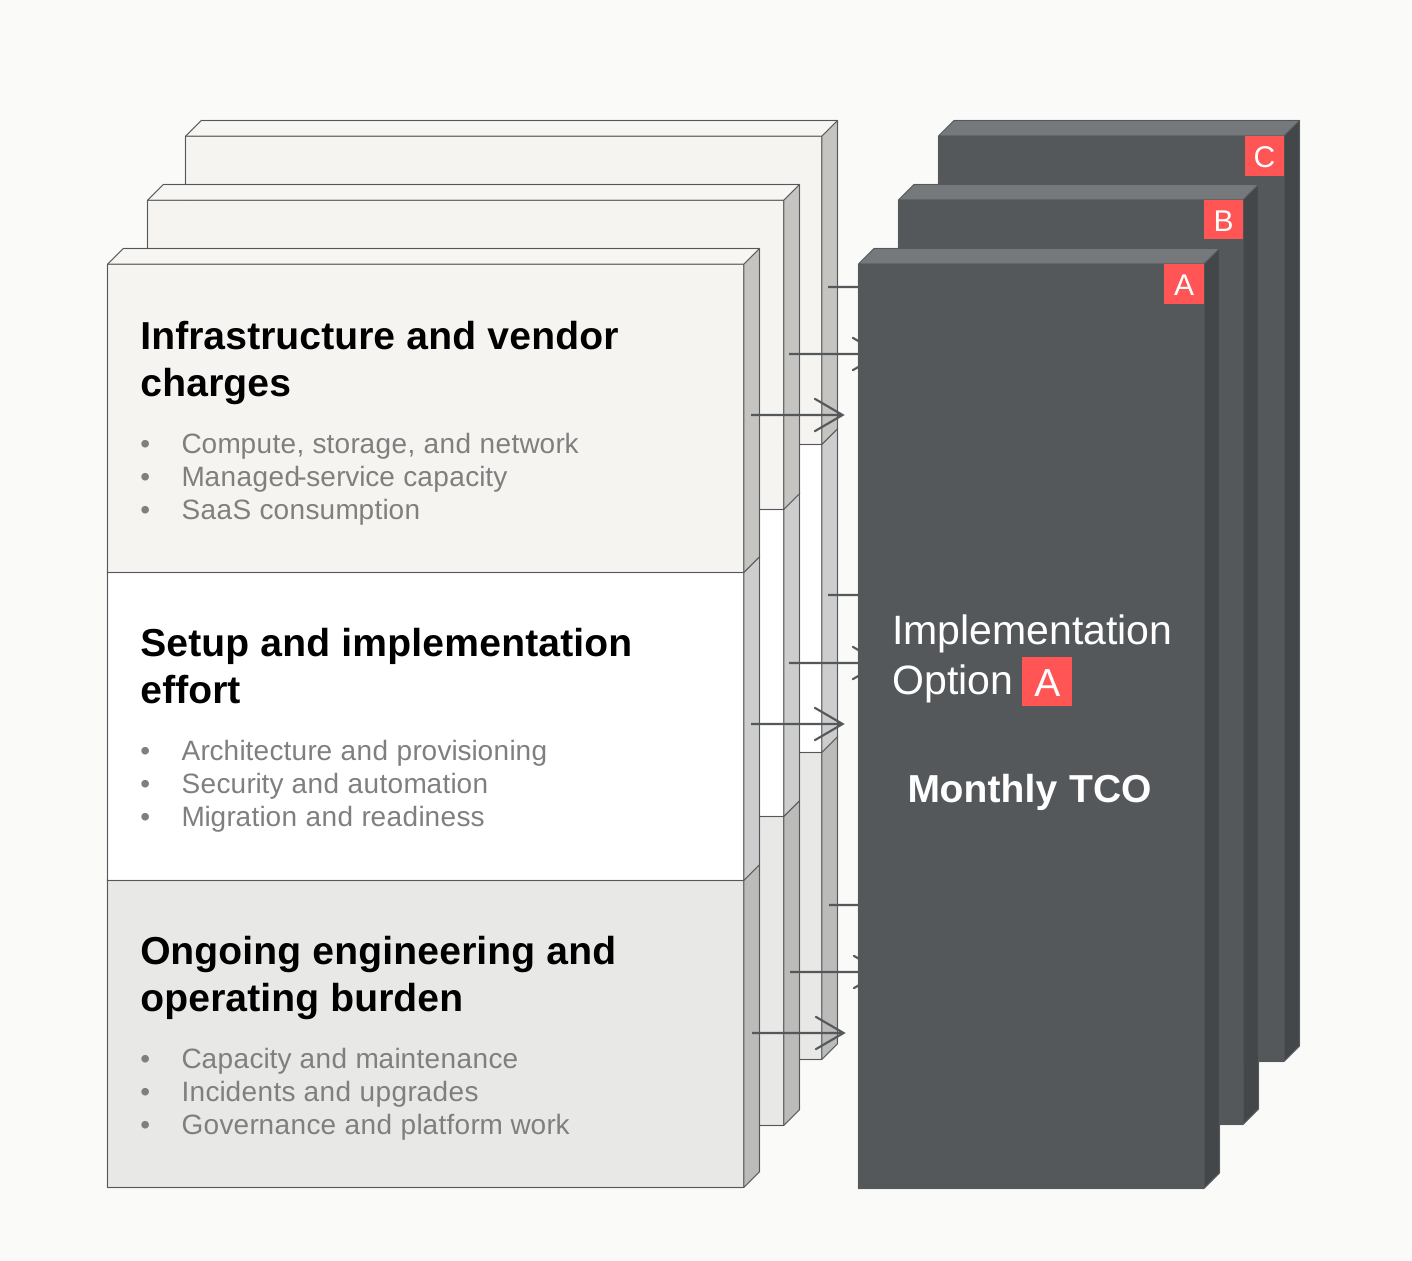
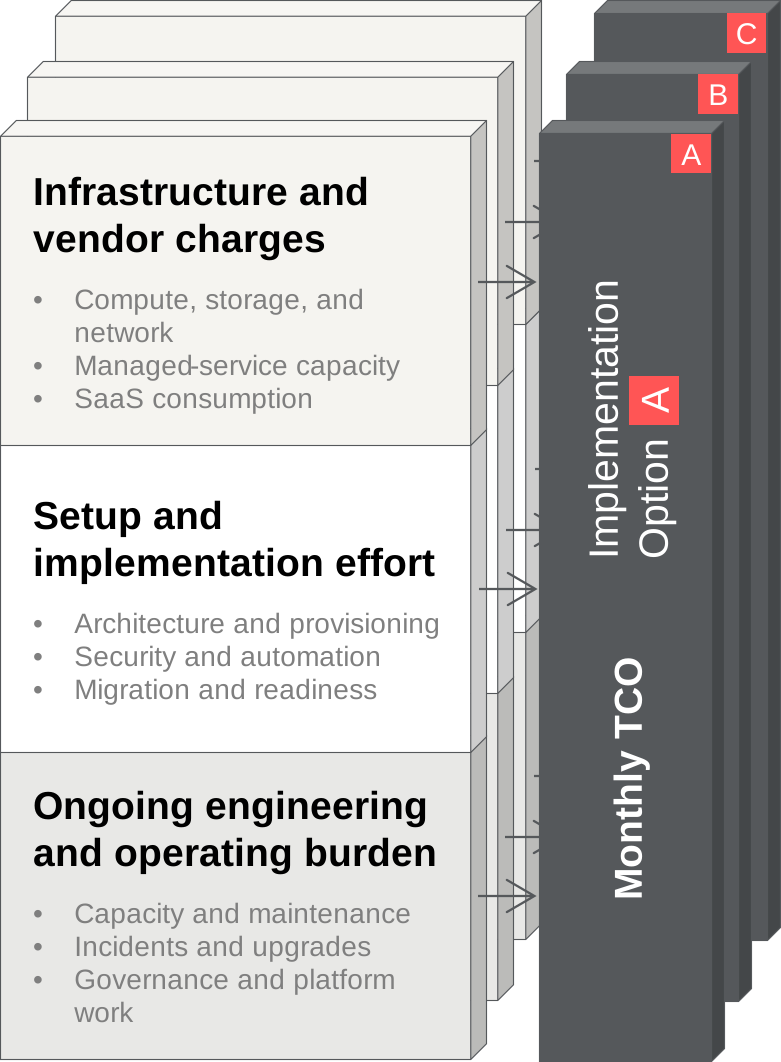
BBRmap models infrastructure vendor charges, setup effort, and the ongoing work required from your team.
BBRmap includes three groups of cost in each comparison: infrastructure and vendor charges, setup and implementation effort, and ongoing engineering and operating burden. Infrastructure and vendor charges are usually traceable to published prices and vendor bills. BBRmap estimates setup and ongoing engineering effort from the workload you define and the responsibilities your team would retain under each alternative.
BBRmap uses the workload information you supply, sources vendor rates from published price lists, and calculates the modeled capacity and engineering effort required for each alternative.
How BBRmap works
You define the workload. BBRmap estimates what each alternative requires and compares the results.
Start by setting the scenario and entering the workload characteristics each alternative must support. BBRmap estimates the required infrastructure and engineering effort, applies your rates when provided or published vendor rates otherwise, and calculates each alternative separately. You can review the assumptions and compare the results on the same monthly basis. In this way, technical assumptions remain visible and reviewable so that the model supports technical and financial judgment, rather than replacing it.
